Reactions on Ukraine-Russia War 2022
with Tweets Sentiment Analysis
Hoesu Chun, Yuna Lee, Cameron Taylor, Jinlin Ye, Yishin Gan, Shanshan Huan
Hoesu Chun, Yuna Lee, Cameron Taylor, Jinlin Ye, Yishin Gan, Shanshan Huan
People’s reaction on Twitter sometimes forms a social movement that impacts world events. Accordingly, we performed sentiment and emotion analysis of tweets to measure and understand the opinions of large populations about the Russia-Ukraine conflict. We believe our interactive visualizations will help us better understand the current situation and trends, which can be used as an important reference for further analysis or related decision-making.
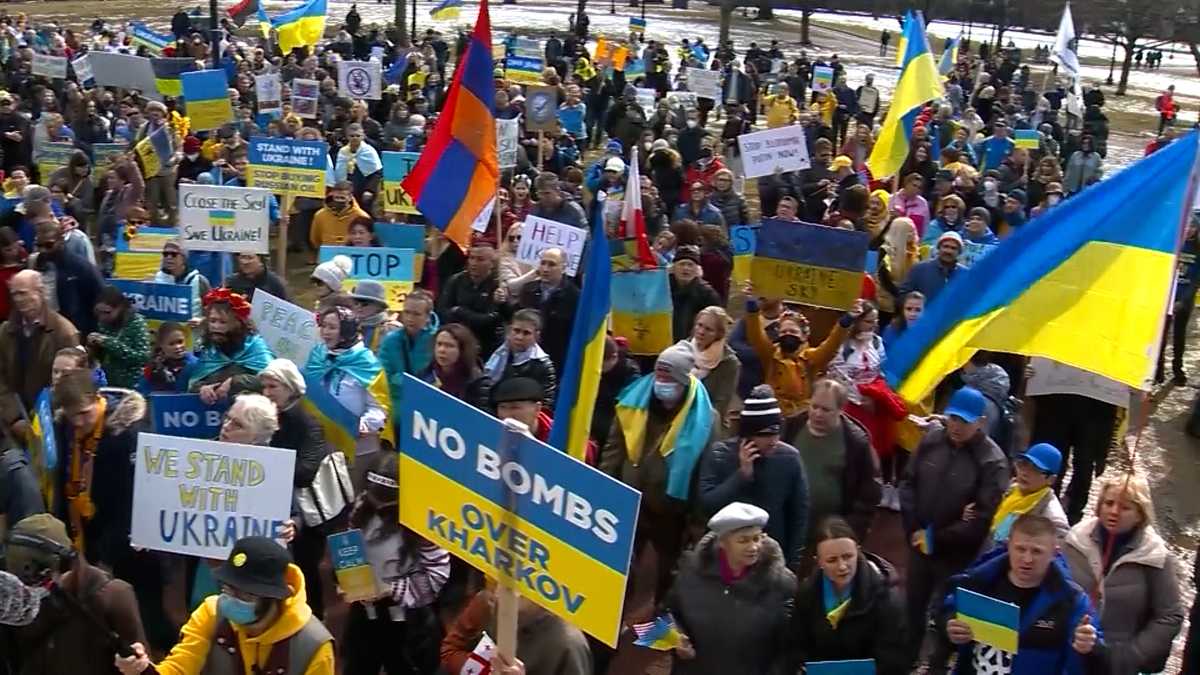
The Russia-Ukraine conflict has been one of the most significant events on the world stage since last year (2021). On the heels of the Covid-19 pandemic, Russia’s invasion of Ukraine has had far-reaching consequences that directly impact the economy, supply chains, and, most importantly, hundreds of thousands of Ukrainian lives. To explore and understand this severe issue deeply, our team decided to use the tweets dataset. The social media platform Twitter has been a great resource for measuring the opinions of large populations through collections of the citizen’s unfiltered opinions. Twitter allows users to “tweet” short messages (up to 140 characters), sharing their views on whatever is currently on their minds. It also includes hashtags that indicate the message the user hopes to convey, which is sometimes used to trigger a social movement. Therefore, we believe the sentiment and emotion content analysis in the text of tweets over time will inform important messages surrounding the conflict in various countries worldwide.
Beyond exploring the tweets, we measured their sentiment/emotion with a pre-trained BERT model. Despite the popularity of sentiment analysis in many fields of study, the Ukraine war is a relatively new topic. Our study aims to add novelty and insight regarding this event. We investigated the trend of opinions towards the war, measured the opinion shifts in specific regions (such as countries that suffered the most from economic or energy crises caused by the war), and studied the correlation between public opinions and conflict events.
However, since the original tweets dataset does not have the label for sentiment/emotion, we could not evaluate the model’s performance. To overcome this problem, we choose the BERT model pre-trained especially with the tweets dataset. This may help reduce the gap between the model’s performances because the tweets for the conflict are also a part of the tweets.
We worked on this project for two months. We used Python for machine learning modeling and pre-processing and D3 for visualization.
We referred to previous studies, which also covered political topics on Twitter. They include elections, propaganda, and military conflicts. (Kušen and Strembeck, 2018)[10] summarizes sentiment patterns of tweets posted by politicians during the Australian presidential election. It mainly describes the reaction difference between winners and losers. (Guido Caldarelli et al, 2020)[3] reveals that leading Twitter propaganda accounts have more bot account followers retweet their content. It explains the user polarization and human manipulation of Twitter content. (Gabel et al., 2020)[8] analyzes the usage of Twitter and the categories of tweet contents during the Jammu and Kashmir conflict. Besides political topics, (Bashar et al., 2020)[2] provides volume analysis, sentiment detection, and semantic brand score on Covid19 comments in Australia. These four studies convinced us of the usefulness of analyzing tweet datasets for political or impactful worldwide events.
(Chen et al., 2022)[4] deals with Ukraine Russia conflict, which is consistent with our topic. It tracks word frequency and hashtags for Tweets, mentioning the war in early 2022. However, we wanted to go further from fundamental text analysis with the updated datasets. We would like to classify the tweets dataset by sentiment and emotions for our research and visualization.
Studies related to the classification of text datasets such as (Nadia et al., 2014)[7], (Anees et al., 2017)[9], (Adyan et al., 2017)[14], (Shun et al., 2014)[16] use Naive Bayes, SVM, DNN, GMM, ensemble, etc., as an approach. (Coletta et al., 2014)[6] use the combination of an SVM classifier and a cluster ensemble as a refined algorithm. (Li et al., 2016)[11] proposes a weighted text feature and word embedding method. (Phan et al., 2020)[12] handles tweet data with a fuzzy word using a feature ensemble approach. However, the aforementioned models and methods are outdated. Some are too basic, and some cannot handle unbalanced datasets well, which may result in low performances. Instead, many recent researchers use LSTM or BERT for text analysis, which manages various types of texts well with advanced embedding functions and model structure. We also adopted BERT for accurate analysis.
(Pota et al., 2021)[13] provides several data preprocessing techniques and strategies for BERT. Moreover, (Chiorrini et el., 2021)[5] and (Singh et al., 2021)[15] suggest the pre-trained model BERT as an approach to analyzing social media text data; one works on emotion recognition, and the other focuses on people’s opinion during the pandemic. We also decided to use a pre-trained BERT model. However, unlike the aforementioned studies, we needed to put more effort into visualization in addition to classification.
(Almjawel et al., 2019)[1] describes Interactive visualization schemes on book reviews. This gave us insight into a visualization for text datasets.
Sentiment analysis is the process of identifying and analyzing the opinions or emotions of the users regarding a specific topic. The large volume of text data on the social media platform favored scientists to apply advanced machine learning techniques to capture insights that lie behind the text. Recent research showed that sentiment analysis results on social media data strongly correlate to public opinions, which can further model a broad concept of international relations or predict social movements. Therefore, we believe sentiment analysis on a current hot potato will be beneficial to understand the public’s stands as well as the topic itself, which might affect the future direction of the issue.
We use the Tweets dataset related to the Ukraine Conflict since Apr 1st, 2022, from Kaggle, which is unexplored by state-of-the-art papers yet. Out of 53M comments, we keep English comments which include country information as well (6.1M). Also, we keep only relevant columns for our analysis: 'userid,’ 'username,’ 'acctdesc,’ 'location,’ 'following,’ 'followers,’ 'tweetcreatedts,’ 'retweet count,’ 'text,’ and 'hashtags.’ The hashtags column is reformatted for easier information extraction.
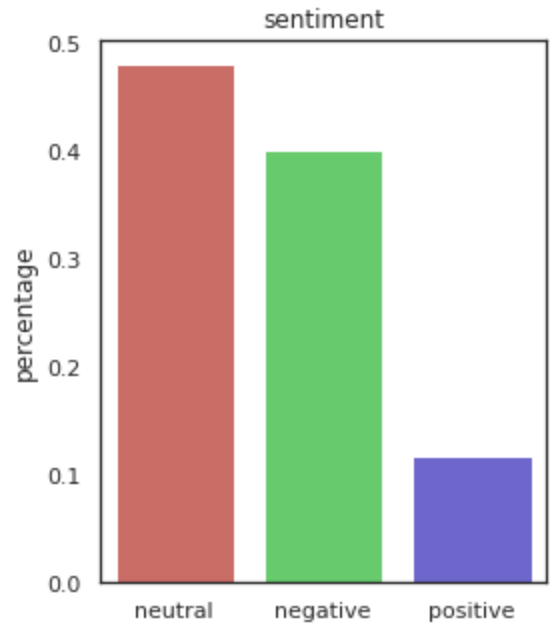
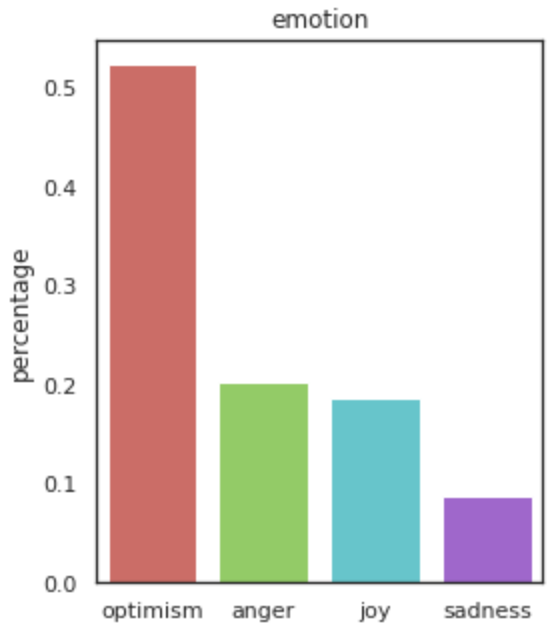
Next, we build a machine learning model, roBERTa, which is pre-trained for Twitter sentiment/emotion analysis. We classify our dataset with the model to identify the text’s sentiment and emotion. The plot below shows the distribution of 6.1M comments according to their predicted sentiment/emotion. The sentiment column consists of neutral (48%), negative (40%), and positive (12%). The emotion column consists of optimism (52%), anger (20%), joy (19%), and sadness (9%). Then, we use python for data cleansing and pre-processing. We create small new datasets for each visualization.
For interactive visualization, we use d3: a graph, bar chart, word cloud, world map, etc. Visualizing the underlying analysis data helps readers better understand a clear-cut concept without reading complicated analysis processes and reports. In this manner, our visualizations also explain the current situation by showing the words frequently mentioned, the relationship between words, and the distribution of the top 30 hashtags worldwide.
Once we understand the dataset and its general trends with exploratory data analysis, we connect the news headlines on a specific date and the sentiment/emotion analysis on the same date to investigate how the sentiments/emotions are affected by the news. As users select the date, news, emotion chart by country, world map with an average sentiment score, and word cloud by country are changed accordingly. They give an insight into how certain exogenous events (e.g., Visa and Mastercard withdrawing from Russia) may have changed the sentiment/emotion about the conflict within impacted countries.
Besides, we build a sentiment world map highlighting the average sentiment scores of each country’s tweets from within the dataset. Users can click a button to automatically watch the changes in sentiment on a world map over time, which clearly displays worldwide trends.
Users can explore all our visualizations, specifying the time frame or the country of their interests with a button provided. This will deliver a more nuanced observation other than the general result; By filtering out the condition, it is easy to check that any decision on a specific date had an impact on a certain country’s opinion.
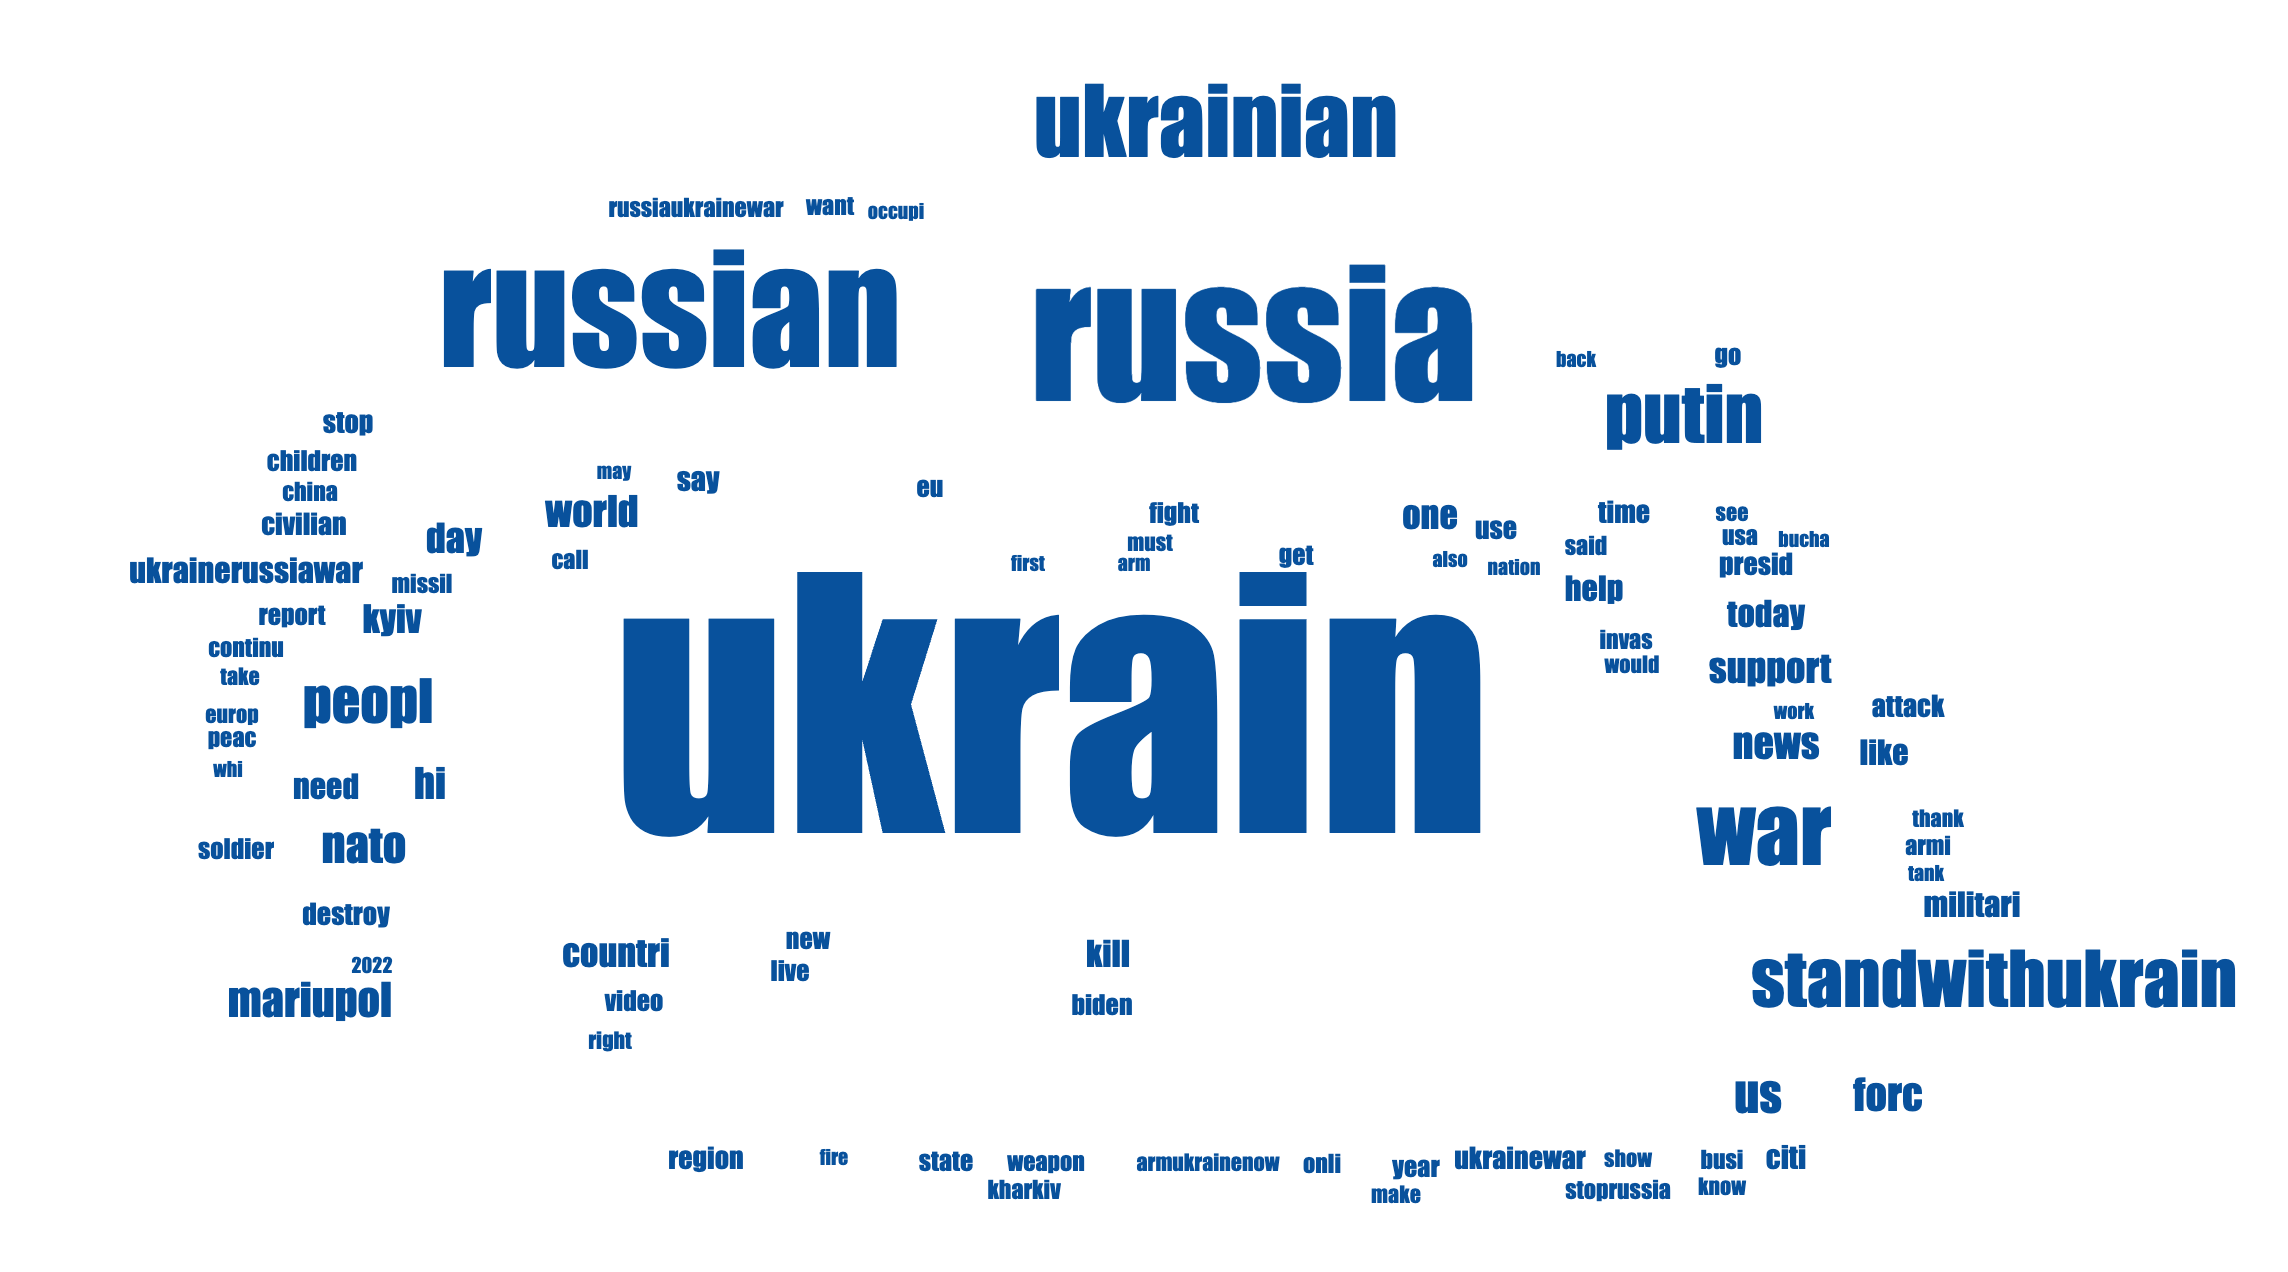
We visualize the word's frequency with a word cloud. The words’ size represents how frequently they appeared in the tweet datasets on Ukraine-Russia War. Most of the big words were neutral words like ‘ukrain,’ ‘russia,’ ‘russian,’ ‘ukrainian,’ ‘putin,’ ‘war,’ ‘nato,’ and ‘kyiv.’ Thus, just with this simple word cloud, users can catch important keywords and understand what is happening without a closer look. The words like ‘standwithukrain,’ ‘support,’ and ‘stoprussia’ may indicate who is an invader and who is a victim. Also, it shows people’s stand toward it.
We visualize the relationship between words using a graph. We expect that terms with high connections may differ from those frequently mentioned and give us new insight. The five words – ‘russia,’ ‘war,’ ‘ukraine,’ ‘putin,’ and ‘standwithukraine’ – are highly correlated and have the highest number of connections with other words as well. This result is similar to the result of the word cloud. However, we could see the terms like ‘killed,’ ‘forces,’ and ‘children’ as words with relatively high connections, which did not stand out in word cloud analysis. These words describe what people are worried about and care for related to the five key words: russia, war, ukraine, putin, standwithukraine.
This world map shows the distribution of Tweets data, including the specific hashtag. We can use the dropdown button to select one of the top 30 hashtags that are mentioned frequently. The tooltip shows the country’s name, the number of tweets that include the hashtag chosen, and the average and maximum number of retweets of that tweet. Also, the second tooltip shows the exact tweet’s contents that got the maximum number of retweets. Interestingly, even though the hashtag ‘russiaukrainianwar,’ ‘russiaukrainewar,’ ‘ukrainerussiawar,’ and ‘ukrainerussianwar’ eventually mean the same, their distribution on the world map was slightly different. Unlike the other three hashtags, ‘ukrainerussiawar’ is visibly mentioned a lot only in USA, Ukraine, England, and India. Moreover, the hashtag ‘ukranian’ is evidently referred to a lot in USA, Ukraine, and England, and the hashtag ‘ukraine’ is conspicuously added a lot in USA and England. This shows the preferences of the way of each country’s hashtags, even with similar content.
This page shows the major war events and how they affect a country’s sentiments and emotions. The top sentence is the central news published on a selected date, and all the visualizations below are connected. Accordingly, every chart will be changed and show the reaction on the same date. The first chart describes the distribution of major countries’ emotions on the same date with a stacked bar chart. Next, the world map visualizes the worldwide reaction based on the average sentiment value of the country’s Tweets. Lastly, the word cloud shows frequently mentioned words that imply significant issues on the same date. We can use the dropdown button to see a specific country’s word cloud. However, it is hard to understand the exact reasons for the connections between the news contents and the sentiment/emotion analysis. For example, the news on 9th August is that ‘In what appears to be the first significant Ukrainian attack on a Russian base on the peninsula, an estimated nine Russian warplanes were destroyed on the ground at the airbase of Saky in Crimea.” On the same date, China showed a visibly large anger percentage on the emotion chart compared to other countries, while China on the sentiment world map indicated their tweets are none. Moreover, the word cloud in China displayed words like ‘taiwan,’ ‘Ukraine,’ ‘space,’ ‘province,’ ‘Monday,’ and ‘us’ with big sizes. To overcome such limitations, we need to do a further analysis that can explain whether the selected news actually affected tweets’ sentiments/emotions or if any other issues affected it.
Sentiment in tweets is highly related to external events. In this section, we plotted sentiment in Ukraine with dates. We could find out which events were most impactful to Ukranians. Next, we visualized how other countries' sentiment changed over time and compared their distributions. Finally, I analyzed the relationship between each country's sentiment.
This world map shows how each country's average sentiment value has changed. We can use the dropdown button to select a specific date and see the distribution of sentiment value. The blue represents positivity, and the red represents negativity. The tooltip shows the country's name, the date, the average sentiment value, and the number of tweets. The ‘Auto Progress On’ button makes it convenient to find any special day that might have a big event by automatically changing the color of the world map over time. For instance, if we play it, most of the time, the countries’ colors on the map are orange, meaning ‘slightly negative sentiments.’ However, on 3rd April, the world map abruptly covered by red worldwide, meaning ‘very negative.’ Searching the news of the day, we actually found the bad issues. This was when Ukrainian forces reported horrors from Kyiv, finding execution-style murders. Also, this was when Russian forces kidnapped at least 11 mayors. In other words, without checking the detailed news, simply by seeing our map, we can guess that something terrible happened that day.
[1] Aljoharah Almjawel et al. “Sentiment analysis and visualization of amazon books’ reviews”. In: 2019 2nd International Conference on Computer Applications & Information Security (ICCAIS). IEEE. 2019, pp. 1–6.
[2] Md Abul Bashar, Richi Nayak, and Thirunavukarasu Balasubramaniam. “Topic, sentiment and impact analysis: Covid19 information seeking on social media”. In: arXiv preprint arXiv:2008.12435 (2020).
[3] Guido Caldarelli et al. “The role of bot squads in the political propaganda on Twitter”. In: Communications Physics 3.1 (2020), pp. 1–15.
[4] Emily Chen and Emilio Ferrara. “Tweets in time of conflict: A public dataset tracking the twitter discourse on the war between ukraine and russia”. In: arXiv preprint arXiv:2203.07488 (2022).
[5] Andrea Chiorrini et al. “Emotion and sentiment analysis of tweets using BERT.” In: EDBT/ICDT Workshops. 2021.
[6] Luiz FS Coletta et al. “Combining classification and clustering for tweet sentiment analysis”. In: 2014 Brazilian conference on intelligent systems. IEEE. 2014, pp. 210–215.
[7] Nadia FF Da Silva, Eduardo R Hruschka, and Estevam R Hruschka Jr. “Tweet sentiment analysis with classifier ensembles”. In: Decision support systems 66 (2014), pp. 170–179.
[8] Sabrina Gabel, Lilian Reichert, and Christian Reuter. “Discussing conflict in social media: The use of Twitter in the Jammu and Kashmir conflict”. In: Media, War & Conflict (2020), p. 1750635220970997.
[9] Anees Ul Hassan et al. “Sentiment analysis of social networking sites (SNS) data using machine learning approach for the measurement of depression”. In: 2017 international conference on information and communication technology convergence (ICTC). IEEE. 2017, pp. 138–140.
[10] Ema Kuˇsen and Mark Strembeck. “Politics, sentiments, and misinformation: An analysis of the Twitter discussion on the 2016 Austrian Presidential Elections”. In: Online Social Networks and Media 5 (2018), pp. 37–50.
[11] Quanzhi Li et al. “Tweet sentiment analysis by incorporating sentiment-specific word embedding and weighted text features”. In: 2016 IEEE/WIC/ACM International Conference on Web Intelligence (WI). IEEE. 2016, pp. 568–571.
[12] Huyen Trang Phan et al. “Improving the performance of sentiment analysis of tweets containing fuzzy sentiment using the feature ensemble model”. In: IEEE Access 8 (2020), pp. 14630–14641.
[13] Marco Pota et al. “Multilingual evaluation of pre-processing for BERT-based sentiment analysis of tweets”. In: Expert Systems with Applications 181 (2021), p. 115119.
[14] Adyan Marendra Ramadhani and Hong Soon Goo. “Twitter sentiment analysis using deep learning methods”. In: 2017 7th International annual engineering seminar (InAES). IEEE. 2017, pp. 1–4.
[15] Mrityunjay Singh, Amit Kumar Jakhar, and Shivam Pandey. “Sentiment analysis on the impact of coronavirus in social life using the BERT model”. In: Social Network Analysis and Mining 11.1 (2021), pp. 1–11.
[16] Shun Yoshida et al. “Sentiment analysis for various SNS media using Naıve Bayes classifier and its application to flaming detection”. In: 2014 IEEE Symposium on Computational Intelligence in Big Data (CIBD). IEEE. 2014, pp. 1–6.